Chapter 1 · Research · Sept 2026 to present

AETHER

Coupled re-entry trajectory, aerothermal and TPS optimisation. Does minimising peak heat flux also minimise the temperature at the bondline, where a heat shield fails?

AETHER · Coupled re-entry trajectory, aerothermal and TPS optimisation · Sept 2026 to present

Peak heat flux is the worst instant of heating at the surface. A heat shield fails at its bondline, where the insulation meets the structure, and the bondline responds to all the heat that gets through over the whole entry. AETHER is an independent capstone that asks whether minimising the first also minimises the second.

The model is a reduced-order coupled chain in Python, written with AI assistance and disclosed item by item in the repository's AI_USAGE.md: US Standard Atmosphere 1976, a 3-DOF entry trajectory, Sutton–Graves stagnation heating, and a 1-D multilayer transient conduction solver with an implicitly treated radiating surface.

Code
github.com/akjakjakjakj/aether
Verification
Conduction solver vs Carslaw & Jaeger analytical solution, grid and timestep convergence shown
Status
Simulation milestones M0–M7 complete, including OpenFOAM CFD. Not complete: the bench thermal-coupon experiment and external review have not happened.
41 of 41

In the model, over a 41-point sweep of entry angle from −8° to −1.5°, peak heat flux and peak bondline temperature move in opposite directions at every step. No entry angle improves both.
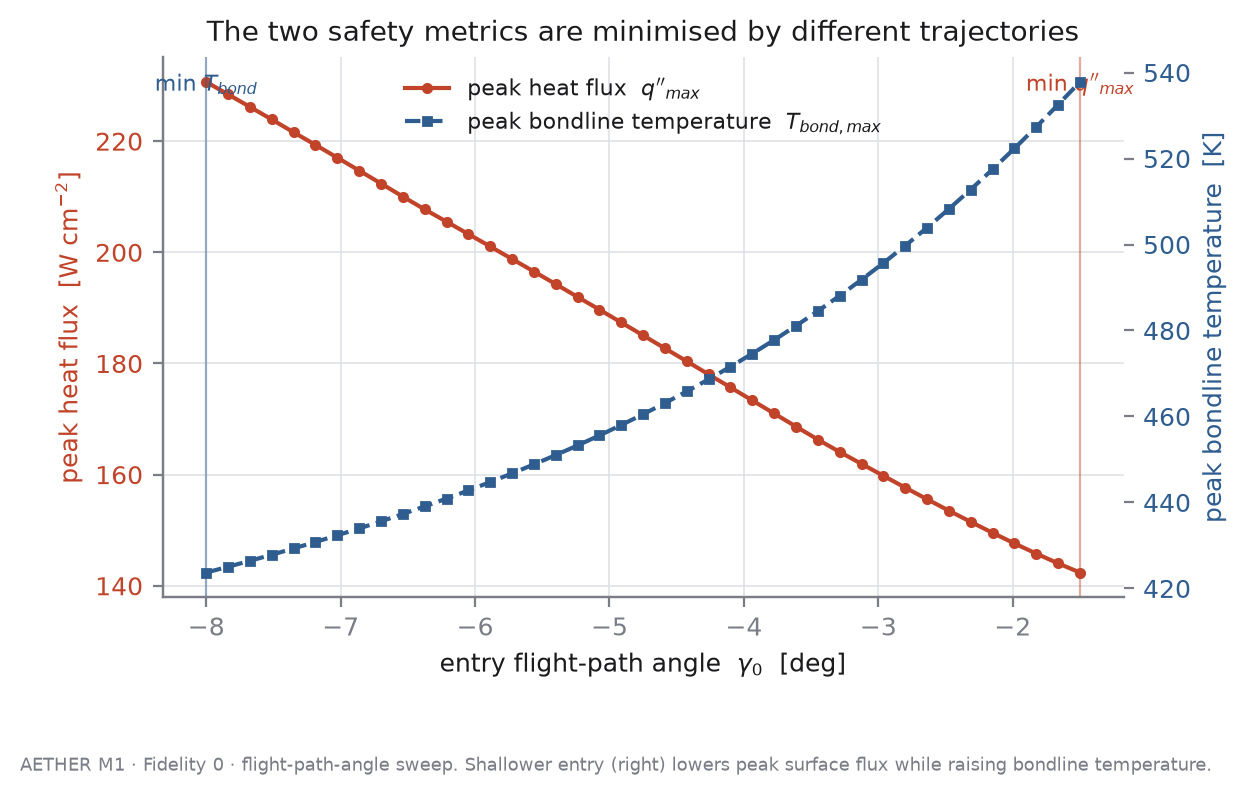
Line plot against entry flight-path angle from −8 to −1.5 degrees: peak heat flux falls from about 230 to 142 W/cm² while peak bondline temperature rises from about 424 to 538 K.
Fig. 1The two safety metrics are minimised by different trajectories. AETHER M1, flight-path-angle sweep. Shallower entry lowers peak surface flux and raises bondline temperature.
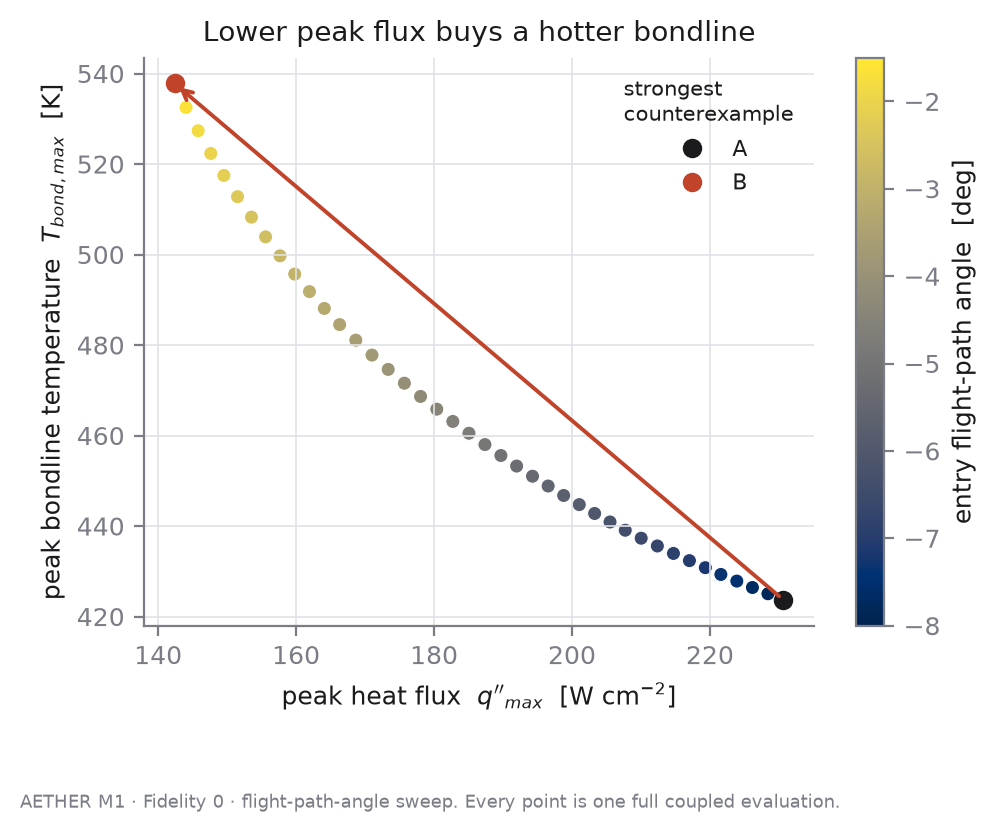
Scatter of peak bondline temperature against peak heat flux, one point per trajectory, coloured by entry angle; points fall on a monotone decreasing curve from design A to design B.
Fig. 2Lower peak flux buys a hotter bondline. Every point is one full coupled evaluation.

Each dot is one trajectory run through the whole chain. The arrow joins the strongest counterexample: design A, the steep entry, and design B, the shallow one.

+114 K

Design B cut peak heat flux by 38% and produced a bondline 114 K hotter. The gentler pulse lasts longer, so more heat soaks through before the surface can radiate it away. Hover or tap the number to mark it on the plot.
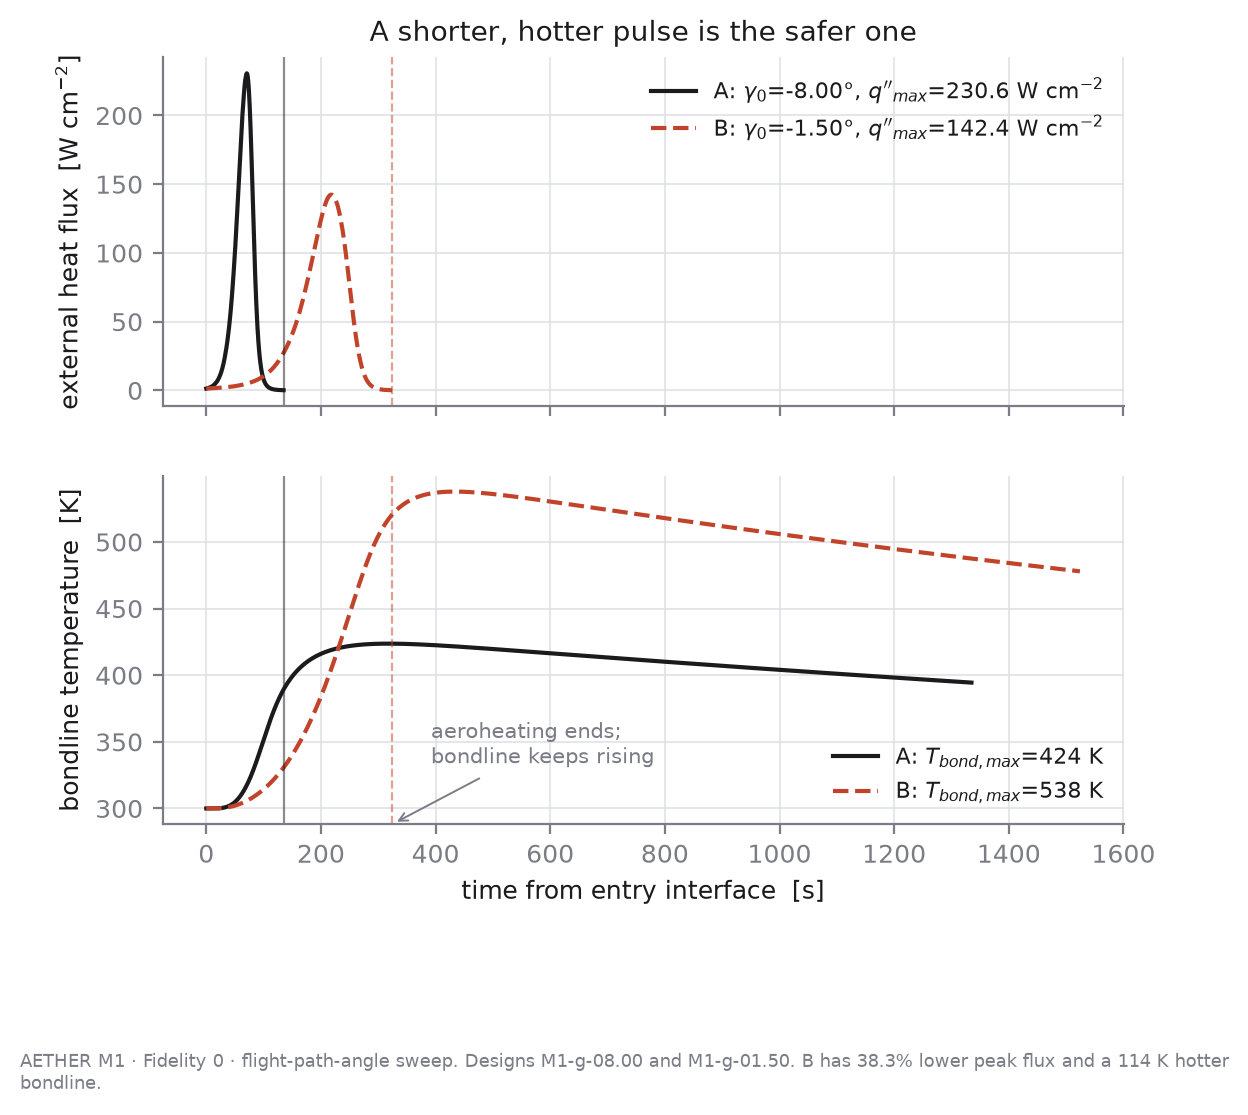
Two stacked time plots. Top: heat-flux pulse A is short and peaks at 230.6 W/cm²; pulse B is longer and peaks at 142.4. Bottom: bondline temperature of A peaks at 424 K, of B at 538 K.
Fig. 3The shorter pulse leaves the cooler bondline. Designs M1-g-08.00 and M1-g-01.50; aeroheating ends, the bondline keeps rising. A pulls 22.6 g, over the model's 12 g limit; B's bondline reaches 538 K, over its 450 K limit. Neither design is feasible. The two marked levels are the plotted peaks, 424 K and 538 K.
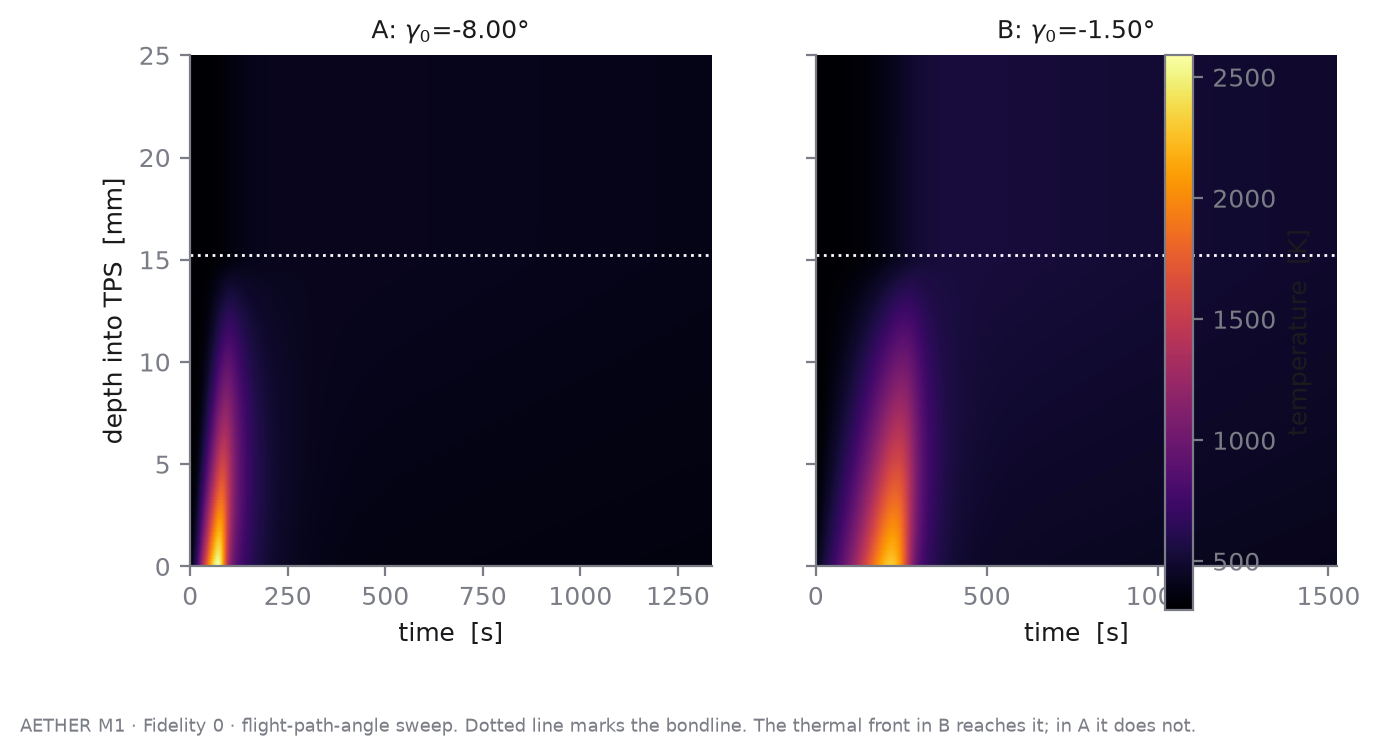
Two heat maps of temperature against time and depth into the thermal protection system. The 500 K front in case B passes the dotted bondline; in case A it stops short of it.
Fig. 4Temperature through the TPS over time. The dotted line is the bondline. The 500 K front in B passes it (24.8 mm); in A it stops at 13.6 mm.
−14.9 K

at the bondline: the knee of the Pareto front against the peak-flux-only optimum, for 21.5 kW/m² more peak flux. It stayed cooler in all 3,000 paired uncertainty draws. That is a result about entry steepness at a geometry pinned by placeholder constraints (the knee design's heat shield is 346 kg of a 350 kg vehicle), not about capsule shape.

0.002%

surface-temperature error of the conduction solver against the Carslaw & Jaeger analytical solution.